Slicers
A slicer is a filter associated with a column that makes it easy to make different filtering choices for a table and makes it quick to change filtering conditions. A slicer is a “box” on a sheet and can be placed where you want it to appear. The slicers can also be edited and formatted.
There can be more than one slicer.
The Objective
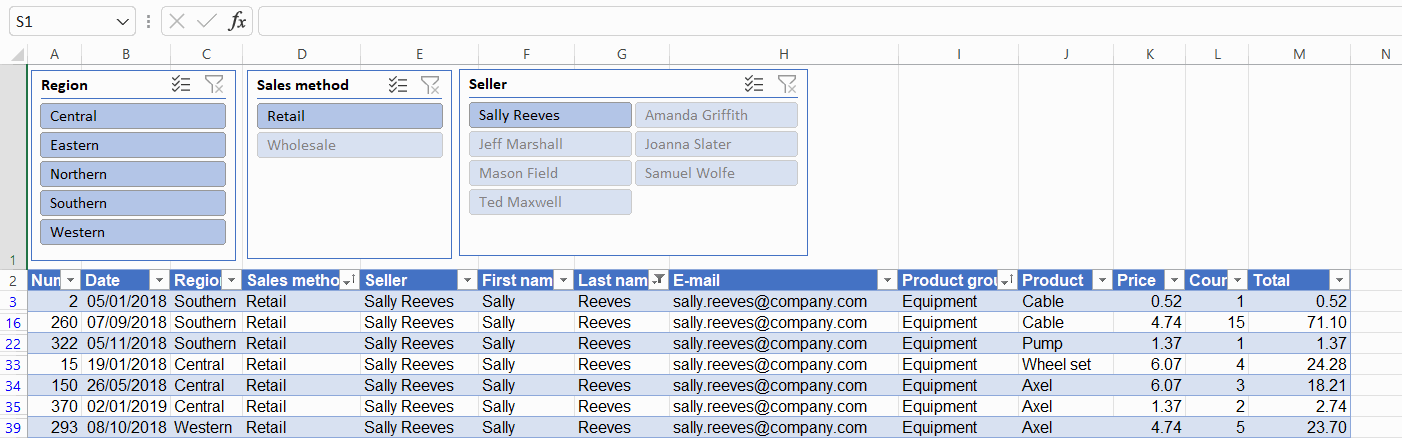
A new row has been added to the workbook, and three slicers (Region, Sales method and Seller) have been added. The slicers are neatly arranged on the spreadsheet according to the model:
Info: Looking at the effects of filtration
You can also use slicers to see which data is affected by filtering.
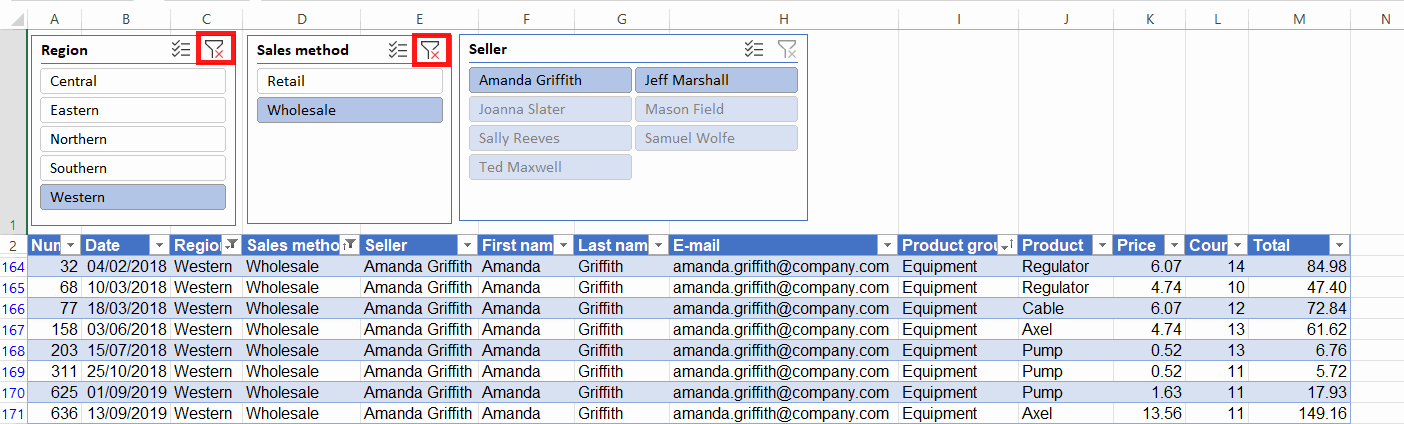
In the above example, the wholesale sales in Western Finland have been filtered by the slicers. In the slicer showing sellers, the sellers are those who have made wholesale sales in the area appear first and highlighted. Sellers who have not made that kind of trade appear dimmed.
Such information is very difficult to see directly from the rows of a filtered table.
Task: Add a separate row for the slicers in the sheet
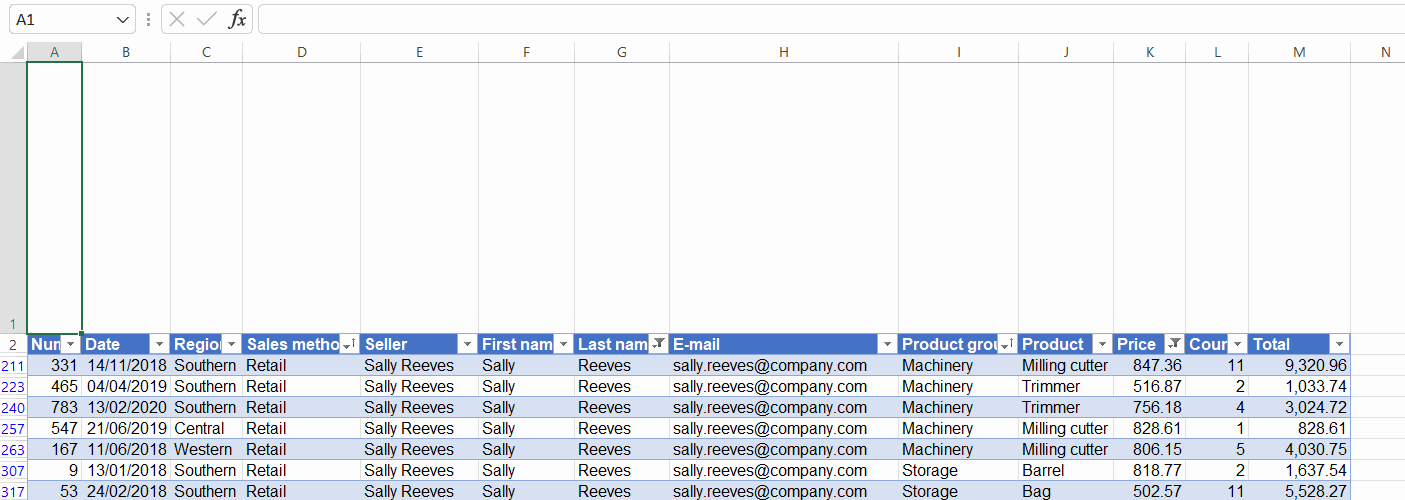
The slicers are separate from the table on the spreadsheet. So add one row above the table on the spreadsheet.
Increase the size of the row you have added, making it tall enough to contain the slicers.
Model:
Task: Add the slicers
Add three slicers to the table: Region, Sales method and Seller. Arrange and format the slicers according to the template.
Model:
Info: Using slicers
Turning filtering off
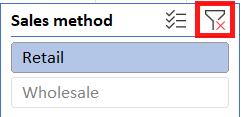
You can turn off the filtering of a slicer by clicking on the funnel icon in the top right corner of the slicer.
Selecting multiple values
If you want to select more than one data from a slicer, use the Ctrl key to select more than one piece of data.
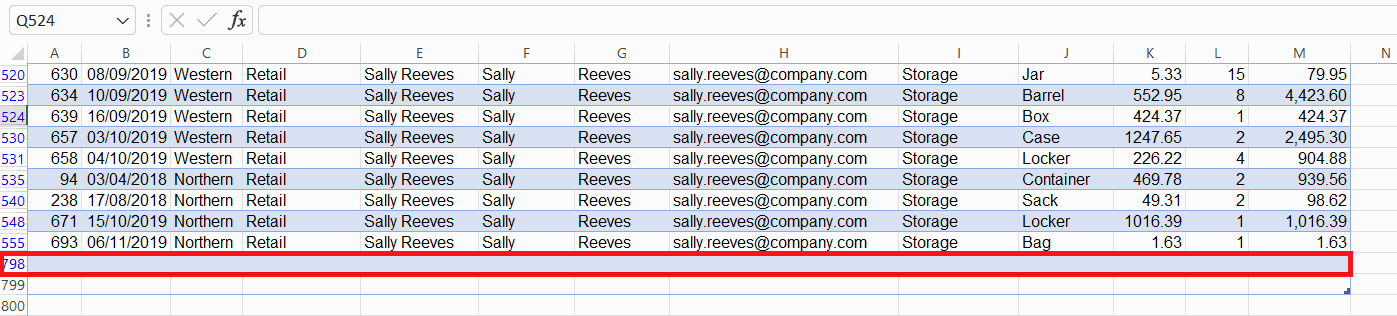
Question: What on earth is (blank) in my slicer?
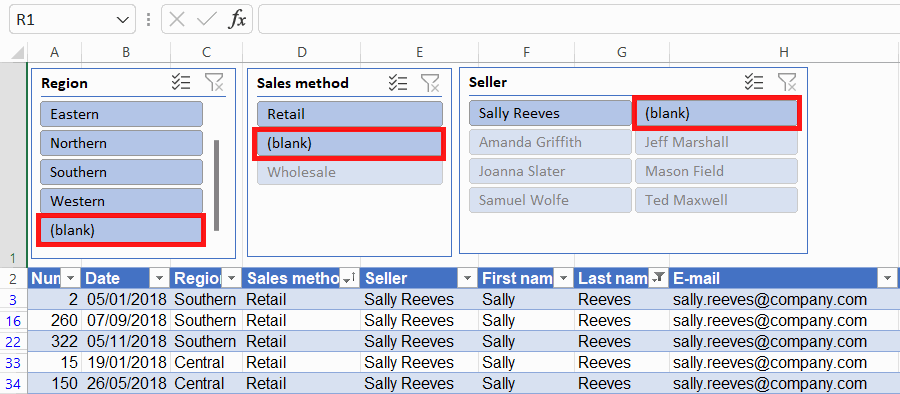
This is because there is an extra blank row in your table. It is usually at the end of the table. If you wish, you can delete the row, in which case the (blank) selection will disappear from the slicer.
We have now gone through the table functionality. Next we will move on to the so-called pivot tables. You're doing well!
If you're going straight ahead, at least take a short break for a walk or do some stretching here. When you think you're ready, click the button below and go to the next page to learn and practice pivot reporting.
Are you ready?