Extra: Grouping Texts
When discussing the grouping of the pivot table, we referred to the possibility of grouping the pivot table based on the text.
Examine the sales of different products by grouping them.
The Objective
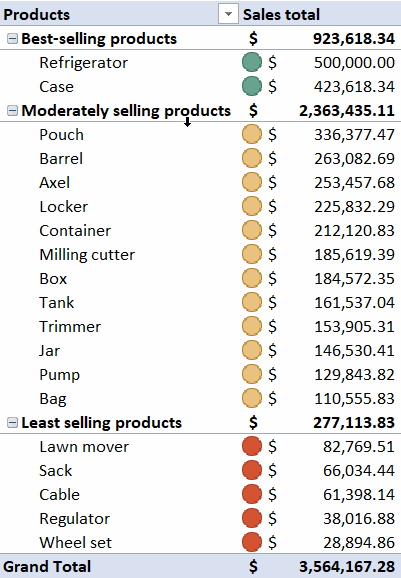
A pivot table has been added to the Best selling products tab, where products are grouped by sales. Sales are grouped into three categories:
- Best-selling products with sales of at least $400,000
- Moderately selling products with sales volume of at least $100,000
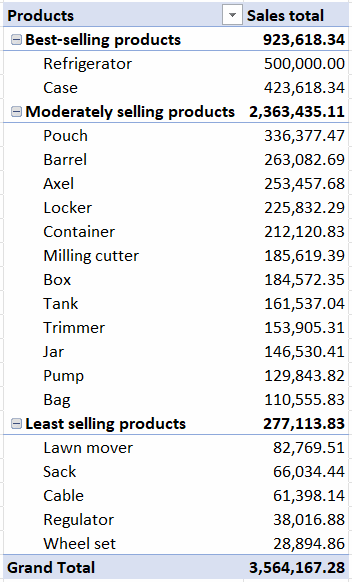
- Least-selling products with sales of less than $100,000
In addition, sales figures are highlighted with icons for the groups.
Task: Upgrade the fridge sales significantly higher
Upgrading refrigerator sales to significantly higher levels. In fact, instead of selling five refrigerators, you sold 500 of them.
So update the number of refrigerators sold in cell L797 from 5 to 500.
Task: Create a pivot table “Best-selling products”
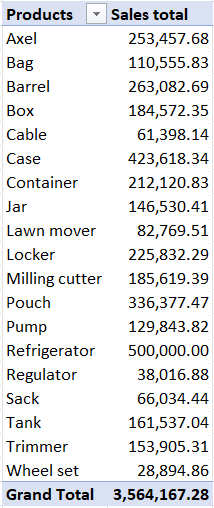
Go to the Sales table. Create a new pivot table and name it Best-selling products.
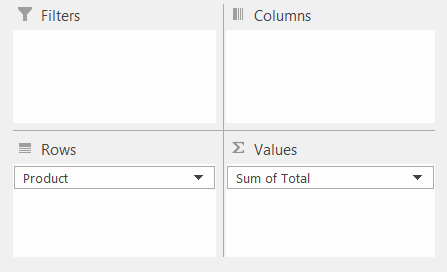
Specify Product as the row header and add Total to the values.
Name the columns more descriptively, for example Products and Grand total.
Model:
Fields:
Task: Sort the products for grouping purposes
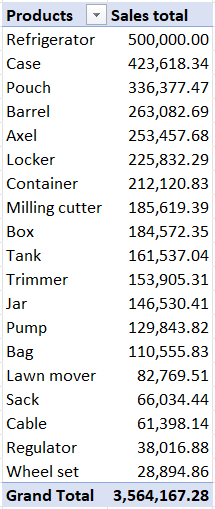
For grouping, we sort products by sales. In addition, we will change the sorting so that it is not updated when the report is updated. This will ensure that the sorting does not interfere with the grouping that is about to take place.
Model:
Task: Add the first group
Next, add the first group to the pivot table. Note that adding the first group creates a group for all other products. Let's ignore this at this stage.
Select products with sales of more than $400,000, i.e. Refrigerator and Box.
Model:
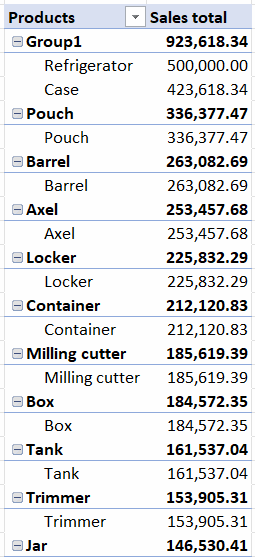
Task: Name the group you created “Best-selling products”
Next, let's name the group you created with a more descriptive title, for example Best-selling products.
Widen the A column to a width wide enough to show the whole title.
Model:
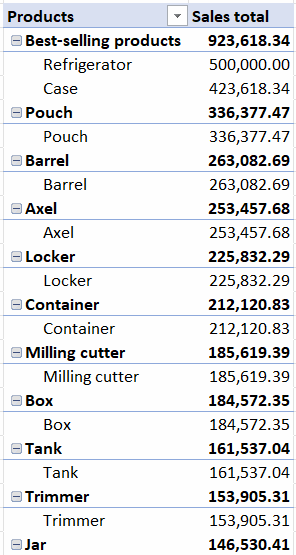
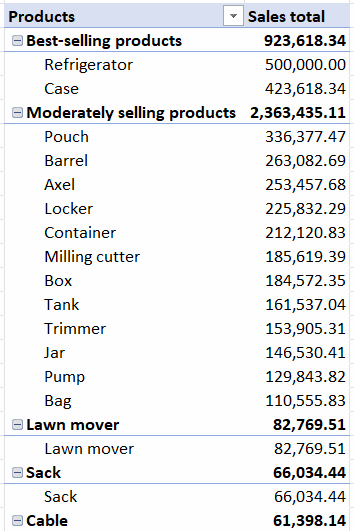
Task: Create another group and name it “Reasonably selling products”
Next, paint all the remaining products with sales of at least $100,000. Create a group of these as above. Name the group you have created Moderately selling products.
Model:
Task: Create a third group called “Least selling products”
Create a group of the remaining products called Least selling products.
Model:
Task: Add color codes to the totals
The color codes shown in the model are part of each Sales total cell. A conditional formatting, represented as an icon, has been added to the cell. The formatting is structured in such a way that it is first created in one cell (the refrigerator sales cell B5), from which the condition is copied to the other cells.
Model:
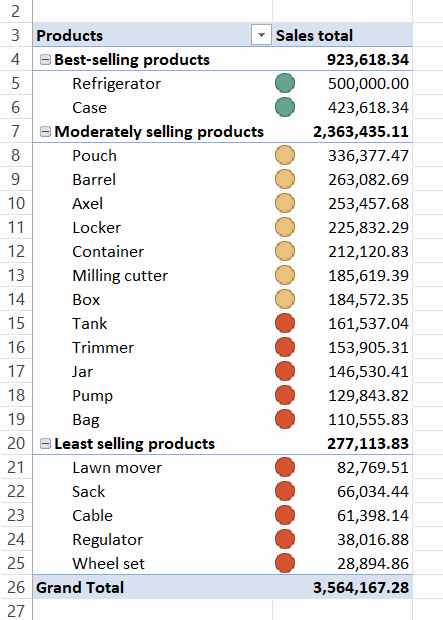
Task: Change the colour codes to match the grouping
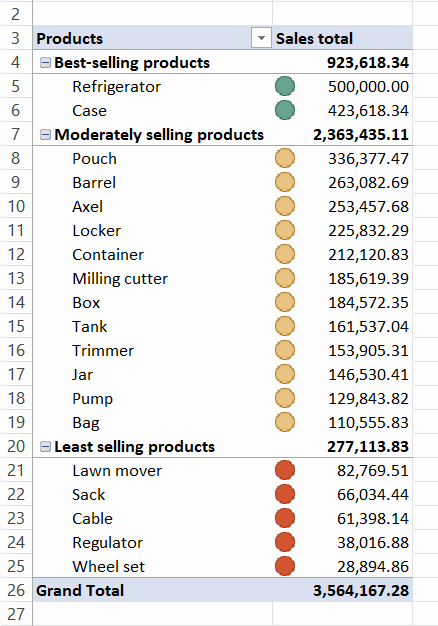
The color codes you have created now use the default settings. Let's change the conditional wording we created to match the limits we used, i.e. $100,000 and $400,000.
Model:
Task: Set the format of Sales total to accounting format
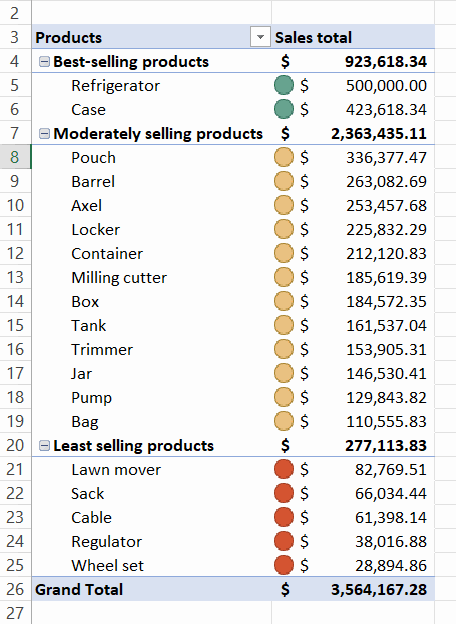
Finally, set the format of the Sales total column to a suitable currency format.
Model:
Did you complete the additional task?