Preview — Office Skills Accelerator course materials (EN). Not production.
Page 17 / 20

Grouping a Pivot Table

Pivot table rows can also be grouped into ranges. In particular, if you add a date as a row header in a pivot table, Excel will automatically group it. Below are some examples of groupings. On this page, we will briefly practice grouping by experimenting with the automatic grouping related to dates and editing it.

Examples of groupings

Date grouping
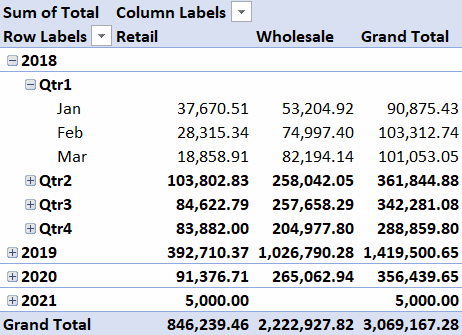
Aineistossa on ryhmät kuukausiin perustuen
In this table, wholesale and retail sales can be viewed on an annual, quarterly or monthly basis.

Grouping is automatically generated when the date field is placed as either a row or column header.

Grouping by price group

aineistossa on ryhmät riviotsikkoihin perustuen
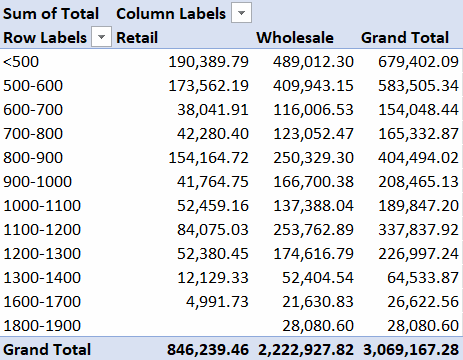
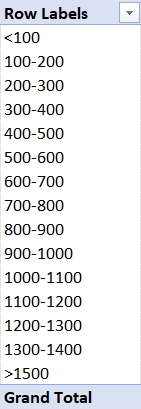
In this table, the price has been placed as a row header and grouped.

Now wholesale and retail sales can be viewed by price group.

Grouping of texts

aineistossa on ryhmät tuotteiden myyntiin perustuen
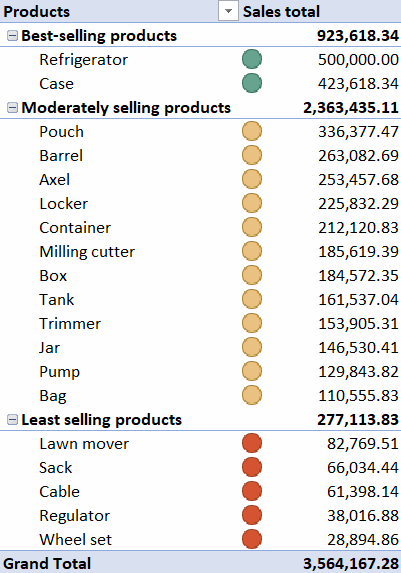
In the table, we have chosen to group the products into three categories. In addition, the table is conditionally formatted to emphasize the point.

The classification could also have been done directly in the source data using the VLOOKUP or XLOOKUP-function, so that it would not have to be done in a pivot table.

But since the pivot table can also be created from a table that cannot be modified, this is necessary in such cases.

We will explore this in more detail in a separate supplementary task: Grouping texts

The Objective

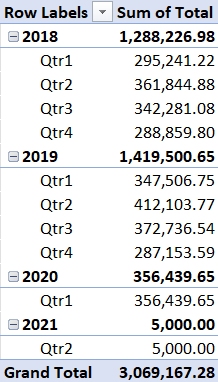
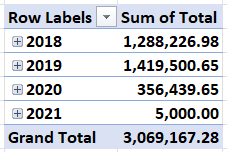
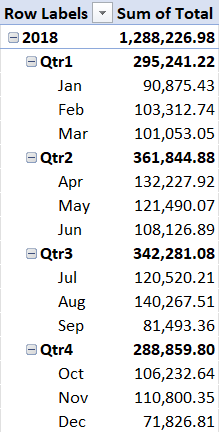
A new pivot table Sales by year has been added to the workbook, allowing you to view sales by year and by quarter:

Task: Create a pivot table “Sales by year”

Go to the Sales table. Create a new pivot table and name it Sales by year.

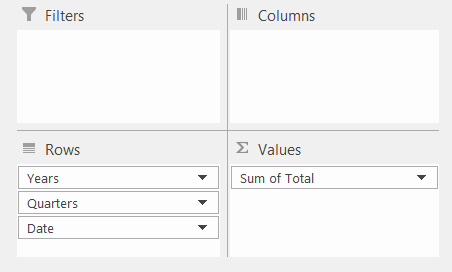
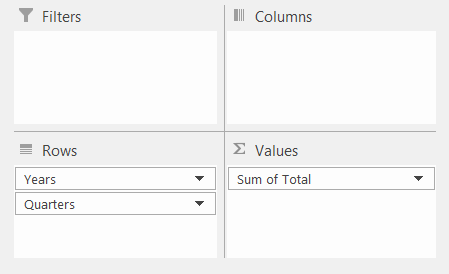
Specify Date as the row header. Notice how in the Rows area, Years, Quarters and Date appear, the last one actually meaning months here.

Set the Total field as a value field.

Fields:

Model:

Task: Expand all information

Let's expand all the data to see the detailedness with which the information can be browsed.

Model:

Task: Remove the monthly level from the grouping

The monthly level can be removed from the grouping by removing the Date field from the row fields. (You can remove it by dragging it outside the area.)

Finally, set the number format to Number with thousands separators.

Fields:

Model:

Info: Editing the grouping
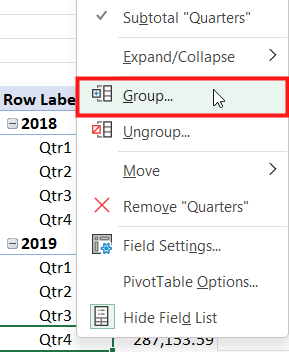
You can edit the grouping by right-clicking on the date field and selecting **Group**.

You can ungroup by selecting Ungroup.

Ryhmittele…-painike on valikon toiseksi alimpana
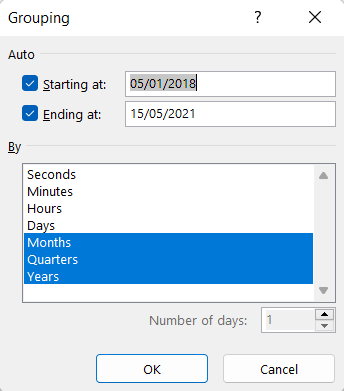
Käyttäjä on valitsemassa Ryhmittelyn Perusteeksi Kuukaudet, Neljännesvuodet ja Vuodet

Select which levels you want to display in the pivot table.

You can also change the date up to which information is displayed.

Info: Grouping of numbers and text
You can also group row and column headers that contain numbers or text.
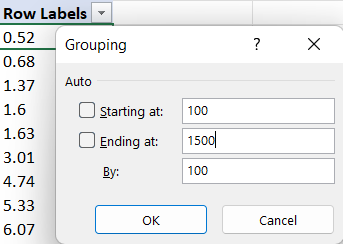
Ryhmittely-ikkunassa voidaan valita Aloitus, Lopetus ja Askel
Right-click on a numer in the header data and select **Group**. You can either leave the default values or change them to your liking.
Kuvassa käyttäjä valitsee sopivaa lukua

The way to group texts is to paint a group of texts with the mouse and then do the above-mentioned Group selection, so that the texts form a single group.

Now it's just a matter of getting to know the pivot chart and practising using it. Shall we move forward?