Multiple Value Fields in a Pivot Table
In the previous chapter, we learned that we can edit the information displayed in each cell if we wish. One way to build a pivot table is to add columns to the pivot table by adding them as separate values. You can also add the same information more than once as a value field.
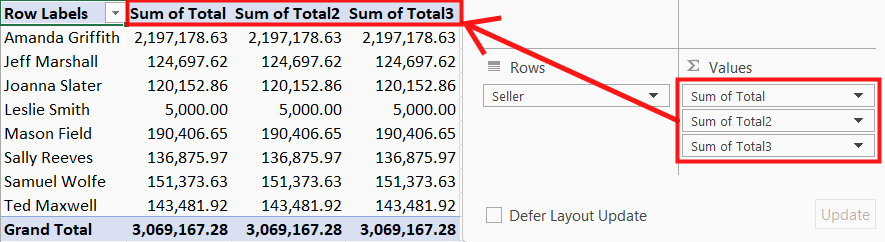
You can change the name of a field to another by typing a new name in the cell. The field name must be different from the original field names.
Video
The bjective
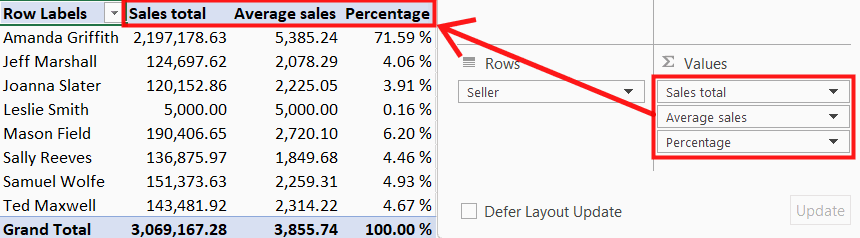
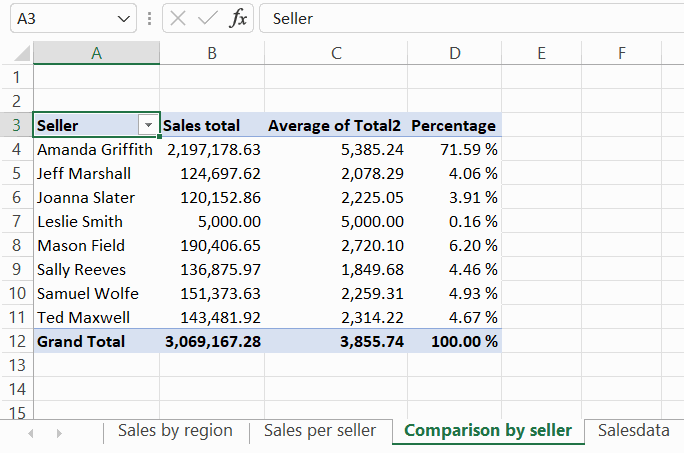
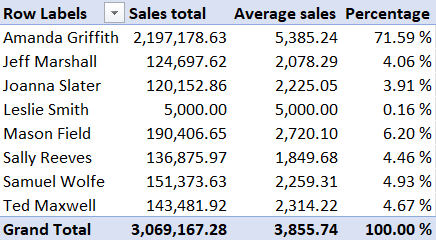
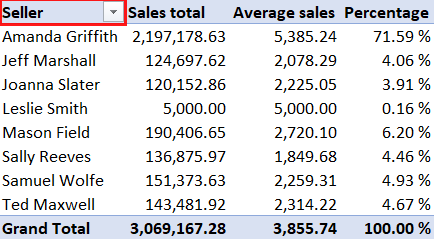
A new pivot table Comparison by seller has been added to the workbook, showing the total sales, average sales and percentage for each seller.
Task: Create pivot table “Comparison by seller”
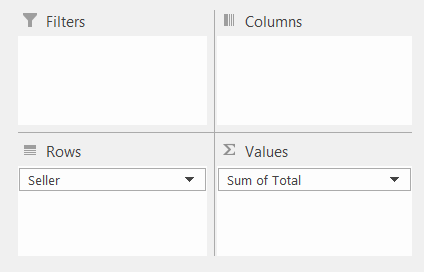
Create a pivot table “Comparison by seller” showing the total sales of each seller.
Format the value fields using Number formatting with a thousands separator.
Name the spreadsheet “Comparison by seller”.
Fields:
Model:
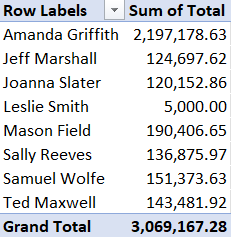
Task: Rename the column header
We are about to add a new column, so at this stage it is better to rename the header thet you have just created. Name the column “Sales total”.
Model:
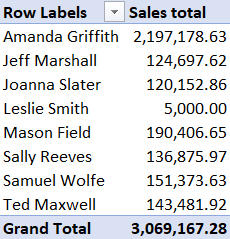
Task: Add the Total field as a value field again
Add Total again as a value field by dragging as usual.
Update again the number format to the type Number and include a thousands separator in the format.
Fields:
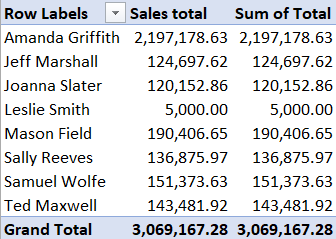
Model:
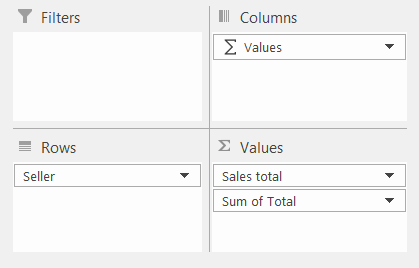
Task: Set the summary type for the second field to average
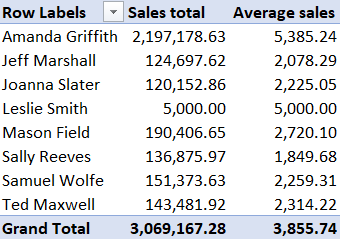
Set the summary type for the values in the second column to Average. Name the column “Average sales”. In this case, the column will contain the average price of the products sold by the seller.
Finally, set a suitable width for the C column in the spreadsheet.
Model:
Task: Add a Total field for the third time
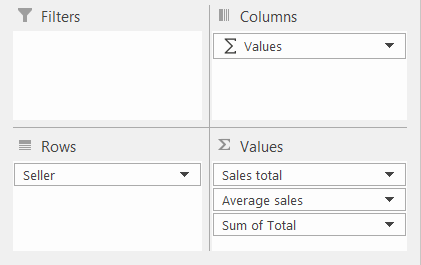
Add the Total field again as a value field.
Fields:
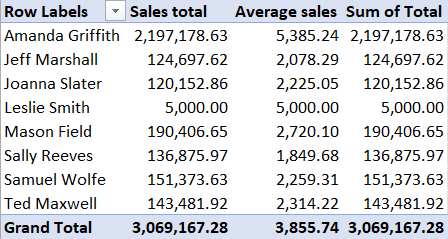
Model:
Task: Show value as percentage
Set the format of the value to % of Column Total.
Title the column “Percentage”.
Model:
Task: Set the header of the first column
Finally, set the header of the first column to “Seller”. This can be done by entering a new value in the cell.
Now that we've used several ways to create pivot tables, you're familiar with the main ways to create pivot table content. As you probably noticed, there were plenty of options for different calculations and summaries in the different menus. The course has given you a glimpse into the key menus that define these. We encourage you to try and explore these different options.
Next we move on to sorting, limiting and grouping pivot tables. We start with sorting. Are you ready?