Sorting a Table
Once a range has been converted to a table, we can easily sort it. Sorting is always done in such a way that whole rows of the table change order, so that the data in the table does not get mixed up.
The table can be sorted by one or more columns. Sorting by multiple columns is somewhat hidden in the interface, so even many advanced users may not be aware of it. Let's look at it next.
The Objective
The table is sorted first by region and then by sales method.
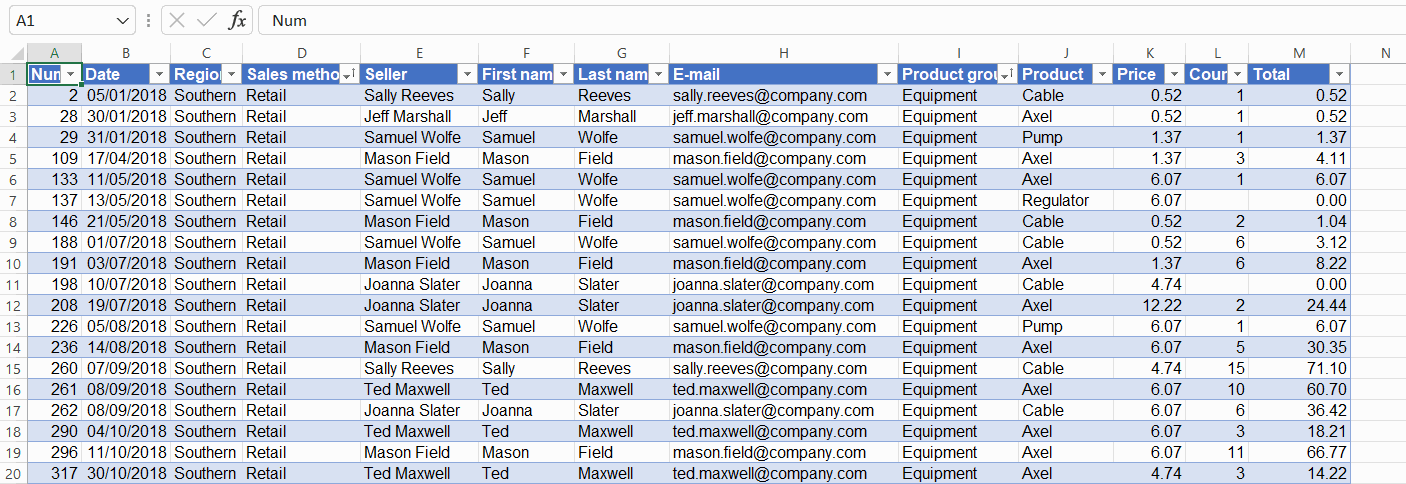
Task: Sort the table by product group
When you want to sort the table by a single column, you can easily do so using the column header.
Let's now sort the table by product category.
Example:
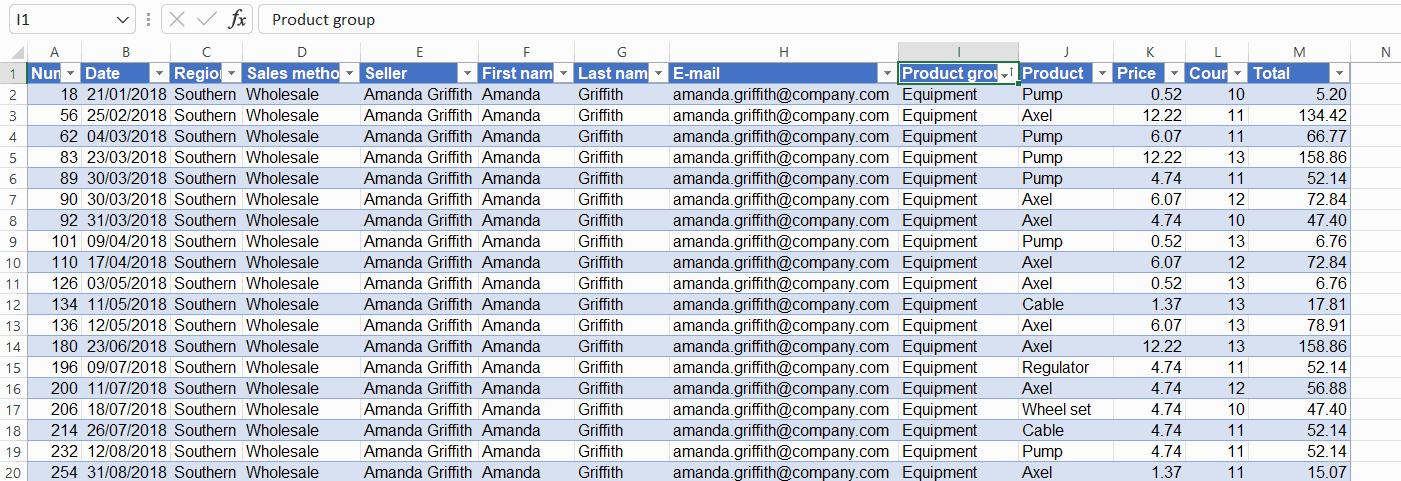
Task: Sort the table by region and by type of sales
Normally, it is not enough for us to have the data sorted by just one column. For example, we might want to sort this table by surname and first name, or by product group and product.
We’ll practice the activity by sorting the material by region and by sales method.
Question: How can I see how the table is sorted?

When the table is sorted, small arrows appear in the filter buttons for the columns that are the basis for sorting. The up arrow (↑) indicates sorting from smallest to largest, the down arrow (↓) indicates sorting from largest to smallest.
Info: Re-sorting when data is added to the table
Usually, new data is added at the end of the table, so that the table is no longer sorted.
You can try what happens when you add a row to the end of the table. Use some information (such as your name) that you can use to find the row later and then delete it.

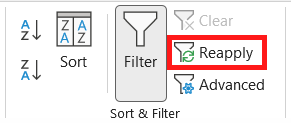 | You don't need to redefine the sorting. You can perform the sorting on all data by clicking the **Reapply** button in the **Sort & Filter** group on the **Data** tab. |
Are you ready?