Pivot Chart
A pivot chart is similar to the chart discussed earlier in the spreadsheet basics, but you create a pivot from a table. In practice, it is a way of visualizing the data displayed in the pivot table. It is not uncommon for a pivot table to be created for the sole purpose of building a chart.
A pivot chart is edited and formatted in the same way as a normal chart, but not everything is available in a pivot chart.
Next, let's create a pivot chart.
Objective
A bar chart has been added to the Sales by year* spreadsheet, showing sales by year:
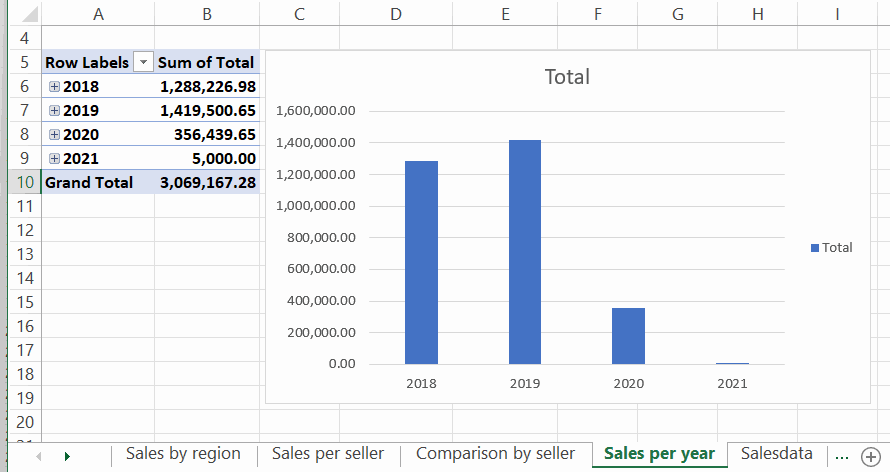
Task: Make a bar chart from the Sales by year table
Make a bar chart of the pivot table in the Sales by year spreadsheet.
Model:
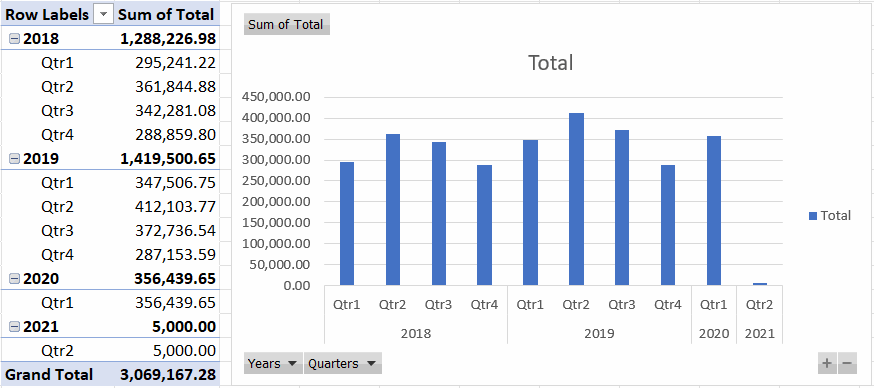
Task: Show only the years
Edit the chart to show only the years.
Model:
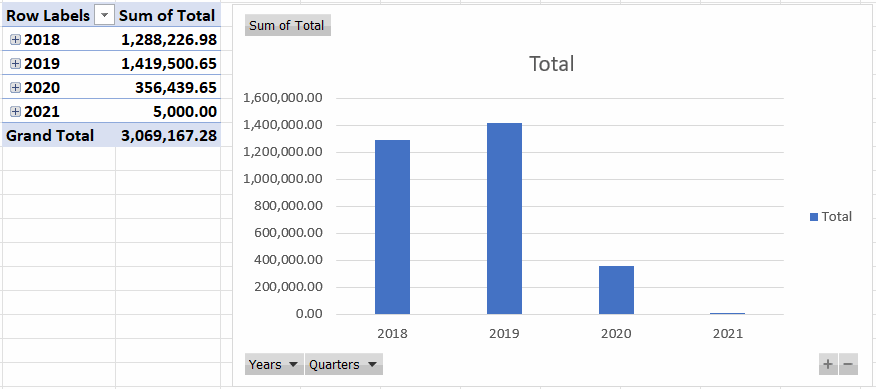
Task: Remove field buttons from view
Remove the field buttons from view. Leave the chart ain a state where it shows the years.
You have reached the end of the third Excel module, congratulations! How do you feel now? What did you find easy and what was perhaps difficult? We would love to hear your feedback on this package.
We welcome your comments and suggestions on the forum or by email to [email protected].
Return
Please send your Excel workbook as an email attachment to [email protected]. Put Excel 3 assignment in the subject line of the email.
Have you returned the task?