Importing a Chart from Excel
In many organizations, for example, result reports are turned into summaries which are presented to others supported by PowerPoint presentations and attached result charts. Usually, these result reports are first prepared in Excel. So it is useful to know how to import diagrams directly from Excel to PowerPoint.
Importing a chart is very similar to importing a table. In practice, that is also done by copying:
- Copy the chart from Excel to the clipboard
- Paste the contents of the clipboard into PowerPoint
Downloading and opening the base file
We will reuse the Excel-file Importing_table_and_chart.xlsx which you already downloaded earlier. In case you deleted it already, you can redownload it here.
Importing_table_and_chart.xlsxThe Objective
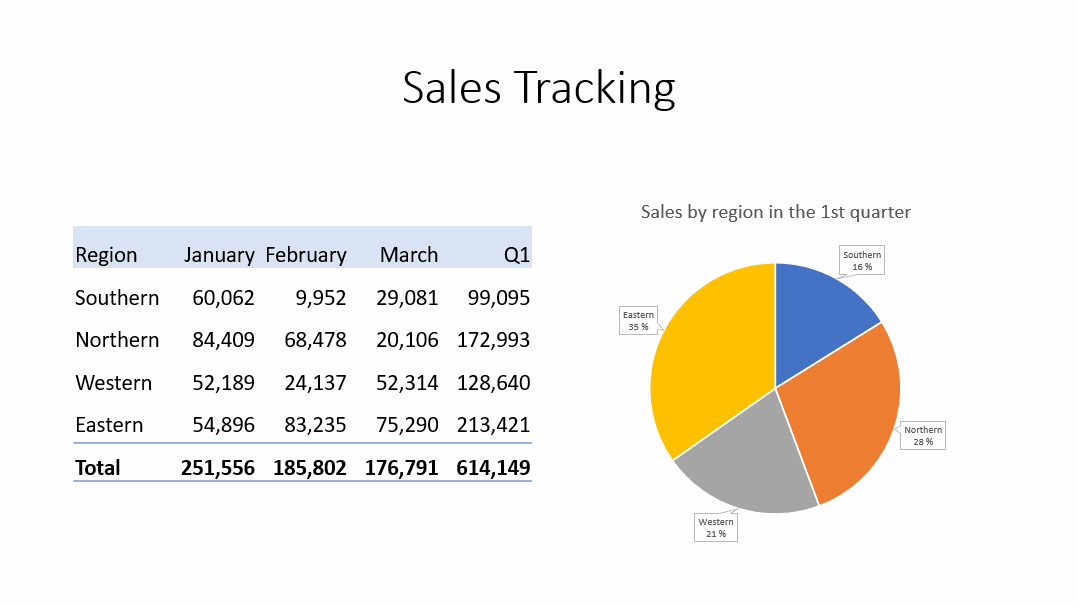
We continue editing PowerPoint_Exercise.pptx, and add an Excel chart to the slide 4. Afterwards the slide might look like this:
Task: Change the template of the slide to contain two placeholders
Let's start by making room for the chart.
Go to slide 4 (Sales Tracking) and change the slide layout to use two content locations.
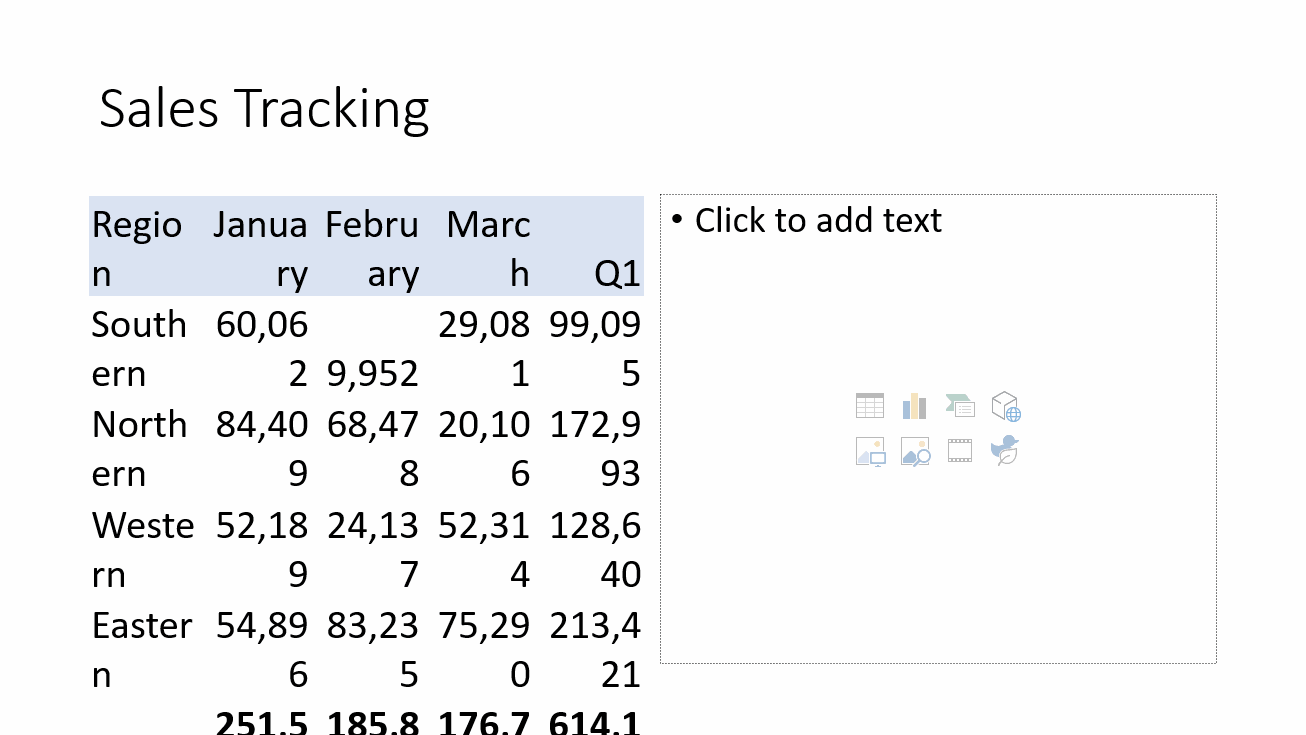
When you make a change, the table may not fit properly into the space given to it. (We'll fix this in a few moments.)
Model:
Video: Selecting Text in PowerPoint Shape
To change the size of the text in the table, we should first select the entire table. You can remind yourself of this how to do it by watching this video.
Task: Fix the table by changing the font size
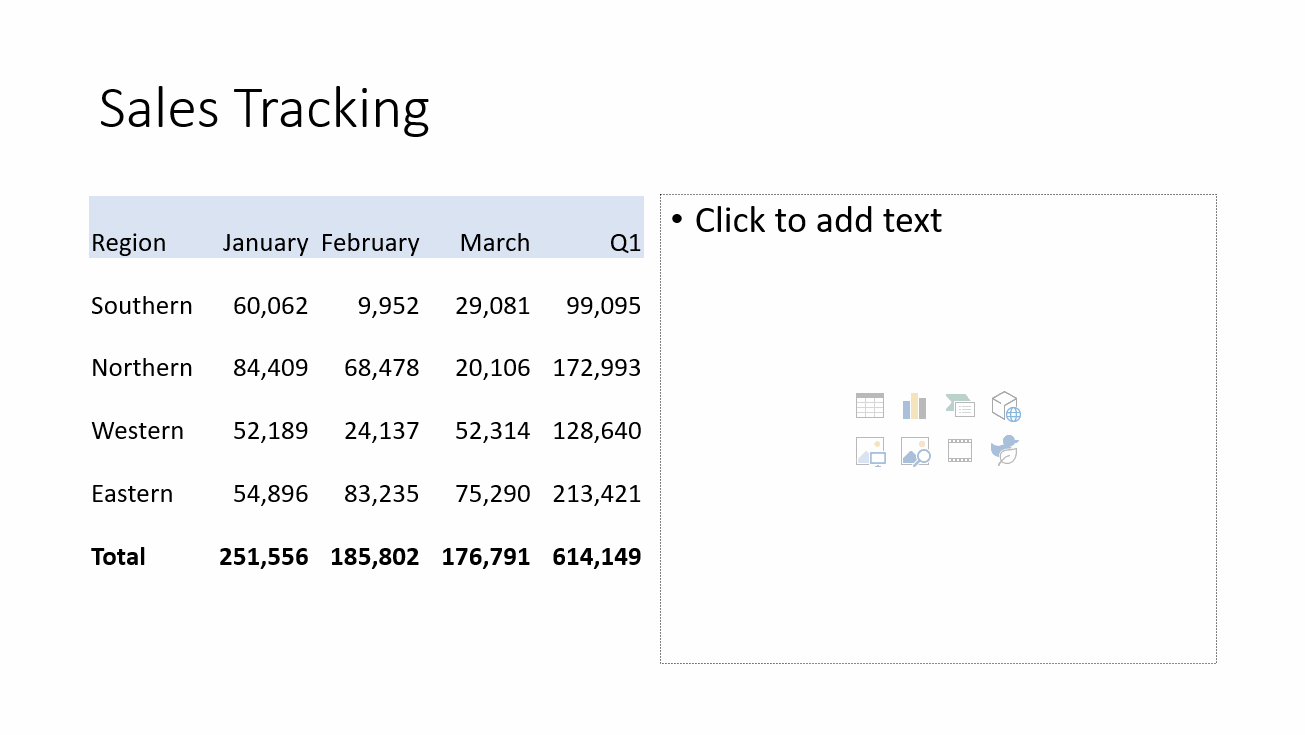
Select the entire table and decrease the font used in it so that all the text fits well into the table.
Model:
Task: Copy the Excel chart to clipboard
Task: Return to the PowerPoint presentation and paste the chart to the slide
Info: Links
 |
When you link data from Excel, you can change the original file by editing it on PowerPoint, by navigating to the **Chart Design** tab, then the **Data** group, and choosing **Edit Data**.
The link is to the Excel data, not to the chart. If you change the file in Excel, you can simply refresh the information in the PowerPoint chart. To do this, navigate to the Chart Design tab, then the Data group, and choose Refresh Data. You can only edit and refresh the data if you have rights to edit the Excel file. |
You made it to the end of yet another page, good! Now you are able to use Excel and PowerPoint as a flexible entity, where you analyze the data in Excel and finally present it to your colleagues or clients in PowerPoint.
Double check that you have completed all the exercises and then move on to the last page of this PowerPoint chapter, which is about printing.
Are you ready?